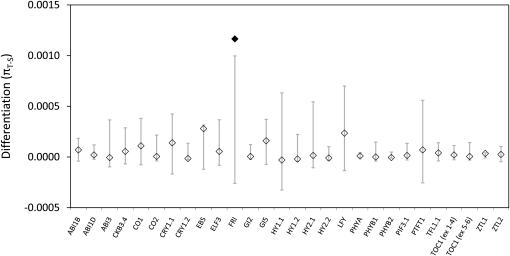
Figure 6 .
Coalescent analysis of nucleotide differentiation between high and low latitude samples. Shaded bars denote 95% confidence intervals around the simulated distribution from the neutral demographic model. Diamonds are observed values of differentiation, with values falling outside of the simulated distributions depicted by solid diamonds.

