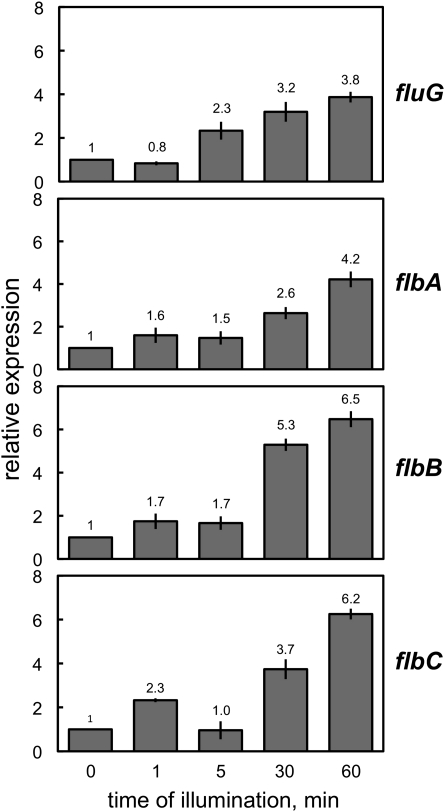
Figure 3 .
Expression of the fluffy genes in response to light. Mycelia of the wild-type strain were exposed to white light for different times and the expression of the genes assayed by quantitative RT–PCR. fluG and flbA–C gene expression was induced by light. Results are shown as relative expression compared to control samples kept in the dark (0) for 60 min prior to RNA isolation. The plots represent the mean value and standard error of the mean of at least three independent experiments.

