Figure 1 .
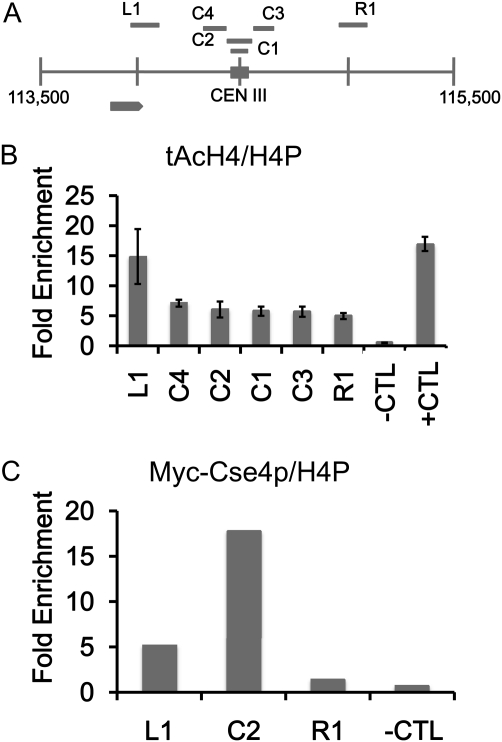
Low levels of acetylated H4 are observed at the centromere. Chromatin immunoprecipitation (ChIP) experiments were performed with asynchronously grown wild-type strains expressing Myc-Cse4p (YMB6955). (A) Diagram of centromere (CEN) (C1–4) and pericentromeric regions (L1 and R1) on chromosome III analyzed by ChIP. Solid square represents the CEN III sequence and each vertical line from chromosomal coordinate 113,500 to 115,500 denotes 500-bp increments. Gray arrow represents an uncharacterized open reading frame (YCL001W-B). (B and C) ChIP with antibodies that recognize acetylated isoforms of acetylated histone H4 (tAcH4) to measure the levels of H4 acetylation at centromeric (C1–4) regions or to Myc to measure levels of Myc-Cse4p at centromeric C2 region and pericentromeric (L1 and R1) regions by quantitative PCR. HML serves as a hypoacetylated H4 control (−CTL) region and SNR189 (SNR) (Chr III: 178729–178589) is a hyperacetylated H4 control (+CTL) region. ChIP for total H4 was performed with antibodies to pan H4 (H4P) that recognize modified and unmodified forms. Bar graphs in B show mean fold enrichment for tAcH4 normalized to total H4 from three biological replicates with error bars showing standard error of the mean. Bar graphs in C show mean fold enrichment for Myc-Cse4p normalized to total H4 from two biological replicates.

