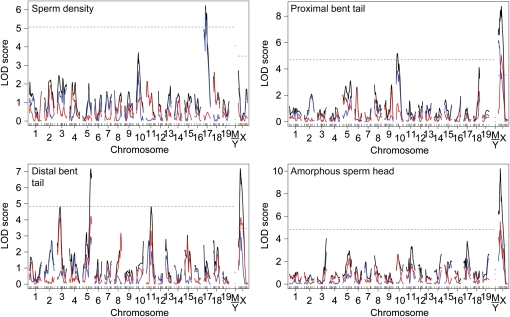
Figure 5 .
Single QTL scans with two-part models. The models evaluate support for QTL associations from the presence/absence of the trait (blue line), the normal portion of the distribution (red line), and the combined distribution (black line). Genome-wide significance thresholds are indicated by the dashed lines and were derived independently for the autosomes and the X chromosome from 1000 permutations of the combined distribution model (black line) (α = 0.05).

