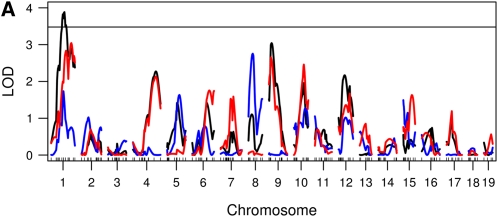
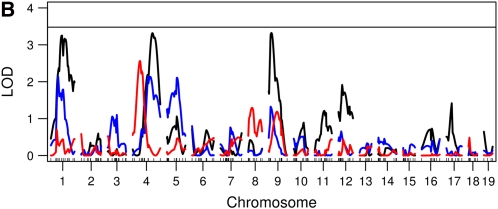
Figure 3 .
Genome scans using a nonfunctional approach. (A) Genome scans for total daily ASP (black), dark cycle onset peak (blue), and mid-dark cycle (red). (B) Genome scans for dark cycle nadir (black), dark cycle offset peak (blue), and light cycle activity (red). The solid horizontal lines are the 5% permutation threshold for the maximum of the six genome scans, which adjusts for the fact that we are examining six correlated genome scans.


