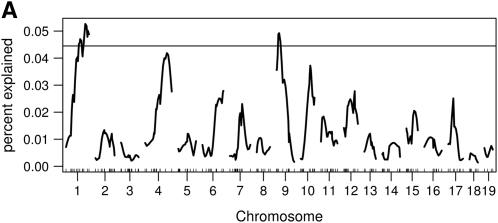
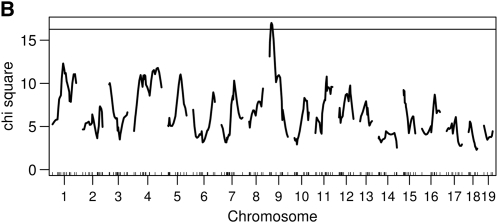
Figure 4 .
Genome scans using the functional approach. (A) A genome scan using the residual error statistics expressed as a proportion of the integrated error explained by a locus. The horizontal line is the 5% permutation threshold. (B) A genome scan using the Wald statistic and the corresponding 5% permutation threshold.


