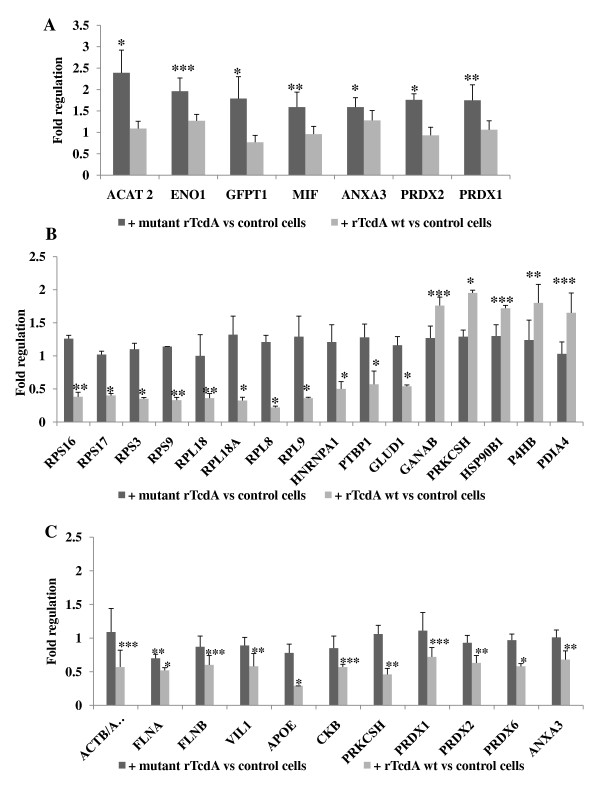
Figure 4.
Regulated proteins in Caco-2 cells after treatment with rTcdA wt or mutant rTcdA. The regulation factors were calculated from all peak area of peptides identified for each protein and normalized to correct protein load. Statistical evaluation was performed using GraphPad Prism 5 (GraphPad Software, Inc.). Bars represent mean ± SD; *, p < 0.05, **, p < 0.001, ***, p > 0.0001 versus control cells. For each protein the corresponding regulation factor of mutant rTcdA or rTcdA wt approach is shown. A) After 5 h of treatment with mutant rTcdA; B) After 5 h of treatment with rTcdA wt; C) After 24 h of treatment with rTcdA wt or with mutant rTcdA.

