
Figure 3.
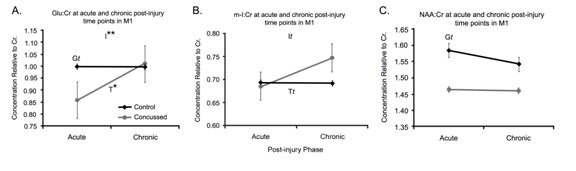
Spectra in M1. A Line graph of the mean Glu/Cr ratios, B represents the means of m-I:Cr ratios and C. represents NAA:Cr ratios for control (black lines, n = 10) and concussed (gray bars, n = 10) athletes in the dorsolateral prefrontal cortex (DLPFC) at the acute and chronic post injury time points. Values are the mean of 24 voxel spectra (10 left hemisphere, 10 right hemisphere) per group. Standard errors of the means are represented by vertical bars. I represents an interaction of Group and Time, T represents an effect of time, and G represents a group effect. Statistically, t represents a trend where p ≤ .10 and an asterisk indicates a statistically significant difference of p ≤ 0.05 and a double asterisks indicates p ≤ .01.