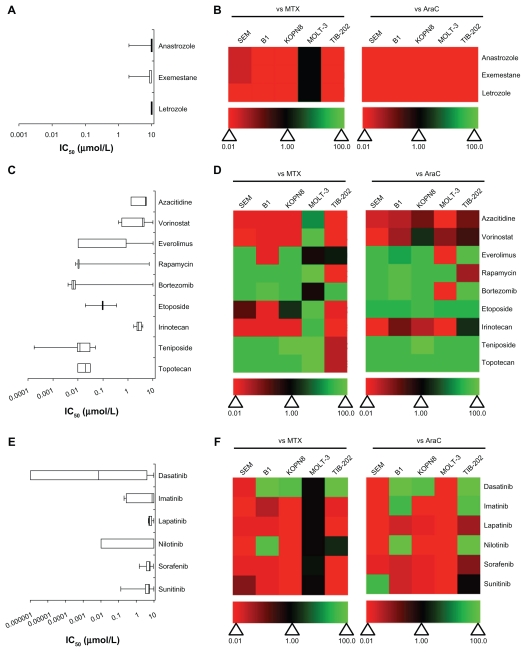
Figure 3.
IC50 and relative effectiveness of enzyme inhibitory drugs. (A and B) Aromatase inhibitors. (C and D) DNA methyltransferase, histone deacetylase, mTOR, proteasome, and topoisomase inhibitors. (E and F) Tyrosine kinase inhibitors. (A, C and E) The IC50 (μmol/L) from five leukemia cell lines are shown in a box-whisker plot. (B, D and F) Heat map of drug effectiveness compared with MTX or AraC. Values are a ratio of the IC50 of MTX or AraC to the IC50 of each drug. Green, black, and red represent superior, equivalent, and inferior activity, respectively, to MTX or AraC.
Abbreviations: AraC, cytarabine; DNA, deoxyribonucleic acid; IC50, half maximal inhibitory concentration; mTOR, mammalian target of rapamycin; MTX, methotrexate.

