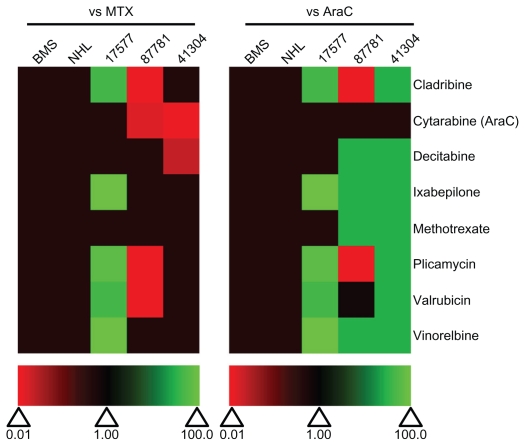
Figure 9.
Relative effectiveness of selected drugs from the Approved Oncology Drug Set II on normal and patient samples. Heat map of drug effectiveness compared with MTX or AraC. Values are a ratio of the IC50 of MTX or AraC to the IC50 of each drug. Green, black, and red represent superior, equivalent, and inferior activity, respectively, to MTX or AraC. 17577, 87781, and 41304 represent the patient samples.
Abbreviations: AraC, cytarabine; BMS, bone marrow stroma; IC50, half maximal inhibitory concentration; MTX, methotrexate; NHL, normal human lymphocytes.

