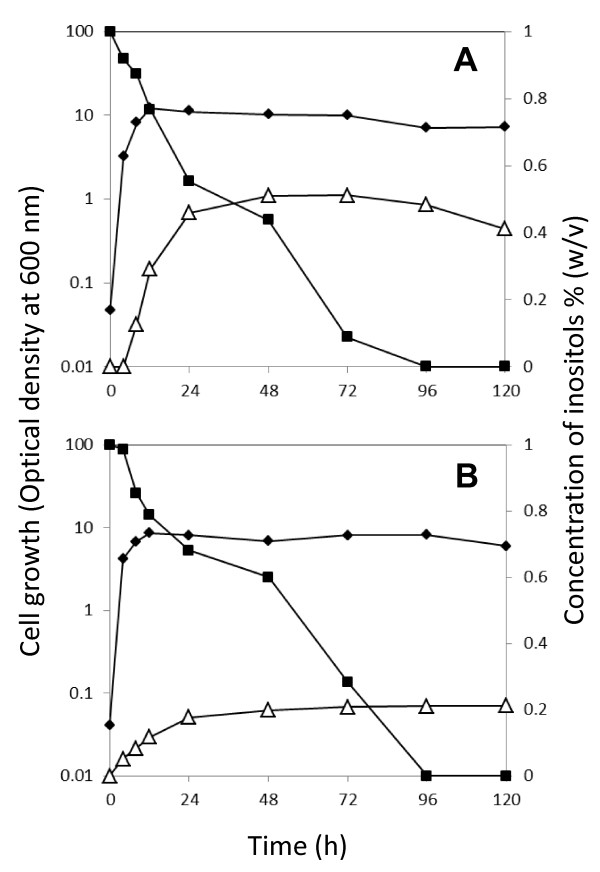
Figure 3.
Time course of scyllo-inositol production and myo-inositol consumption during inositol bioconversion along with the cell growth. The bioconversion from myo-inositol to scyllo-inositol was performed in the media containing 2% (A) or 1% (B) Bacto soytone. The data presented are optical density of the cells (black diamonds), and concentration of myo-inositol (black squares) and scyllo-inositol (white triangles). The experiments were repeated independently at least three times with similar results, and the representative data sets are shown.

