
Figure 2.
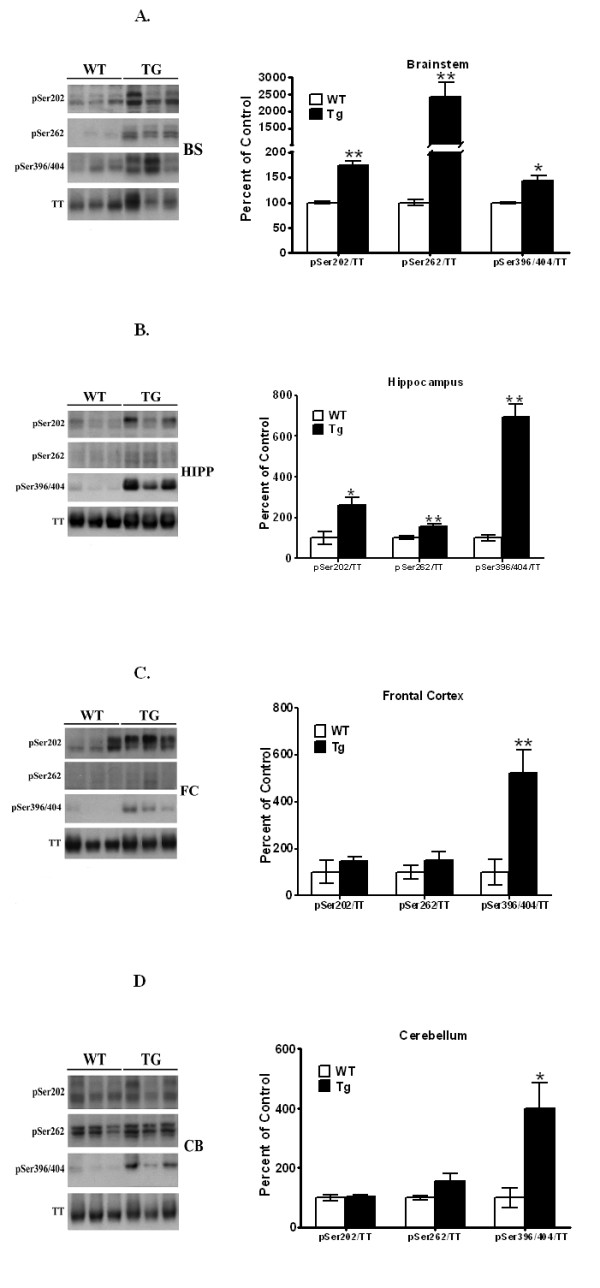
Western blots of p-Tau levels in brain stem, hippocampus, frontal cortex, and cerebellum of PDGF-α-Syn overexpressing transgenic mice. Brain stem, BS [A], hippocampus, HP [B], frontal cortex, FC [C] and cerebellum, CB [D] from PDGF-α-Syn transgenic mice and litter-mate non-transgenic mice [WT] were solubilized in RIPA buffer and analyzed by Western blots for p-Tau levels. The following p-Taus were normalized to total Tau: p-Ser202, p-Ser262, and p-Ser396/404. All values are expressed as percent change relative to changes observed in WT control animals. Results are from 3-4 animals per group; [*, p < 0.05] and [**, p < 0.01] compared to corresponding protein levels in WT animals. All blots are representative of samples.