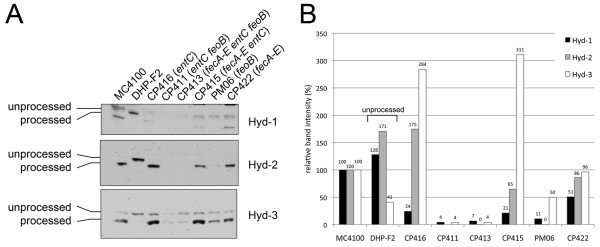
Figure 3.
Analysis of hydrogenase large subunit processing. (A) The three panels show portions of Western blots in which the large subunits of Hyd-1, Hyd-2 and Hyd-3 (HycE) are shown. The positions of the unprocessed and processed forms of the polypeptides are indicated on the left of the Figure. Crude extracts (25 μg of protein) derived from cells grown anaerobically in TGYEP plus formate were separated in 10% (w/v) SDS-PAGE and incubated with antibodies specific for the respective enzymes. (B) Densitometric quantification of the processed protein bands (and for the unprocessed band from DHP-F2) corresponding to Hyd-1 (black bars), Hyd-2 (gray bars) and Hyd-3 (white bars) from the western blot. Values were calculated as relative intensities compared to the intensity of the wild type MC4100.

