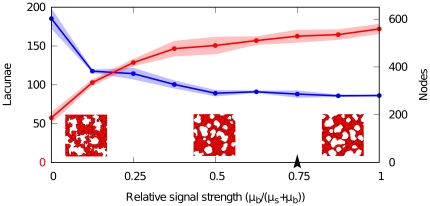
Figure 5. Sensitivity analysis of chemotactic signal strength.
Sensitivity of morphometric parameters to relative strength of bound ( ) and soluble (
 ) VEGF. Red points (lacunae) and blue points (nodes) show averages of measured quantities in simulations (n = 3), half-transparent regions represent standard deviations. Insets show portions of networks (200×200
 ) where the relative signalling strength (
 ) is set to soluble-VEGF-only (
 , left), bound-VEGF-only (
 , right) and equal strengths (
 , center). Arrowhead indicates the reference value.

