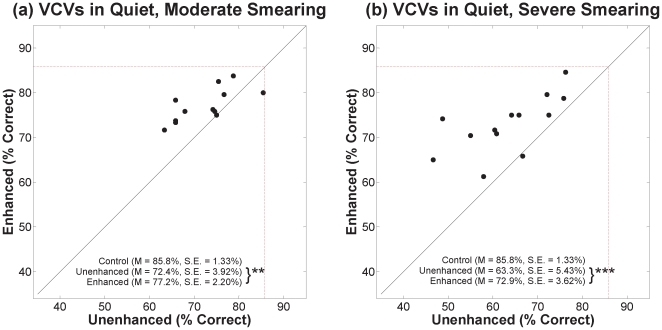
Figure 4. Scatter plots of percent correct for VCVs in quiet.
Results for moderate and severe degrees of smearing are in panels (a) and (b), respectively. Percent correct for unenhanced speech is represented along the abscissa and percent correct for contrast-enhanced speech is represented along the ordinate. The red dashed box represents the percent correct for the control speech (no smearing, no enhancement). The mean and standard errors for each condition are displayed on the graph. Asterisks indicate the significance level for paired t-tests [** for p≤0.01 and *** for p≤0.001].

