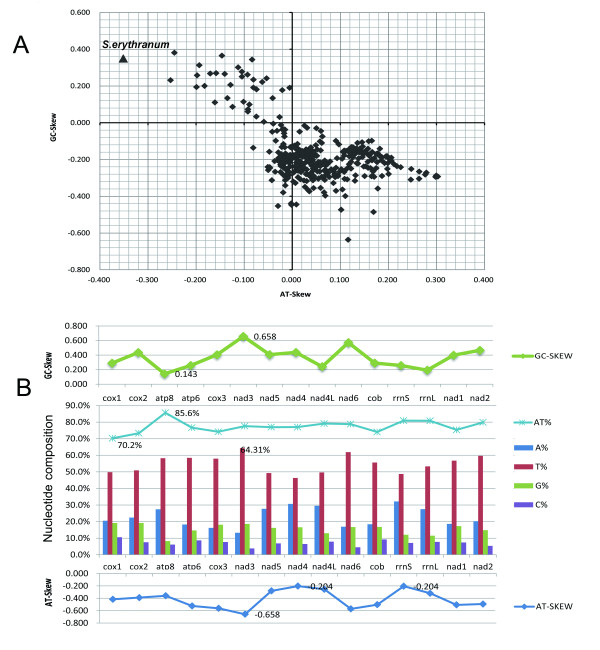
Figure 2.
Severe strand asymmetry of the mitochondrial genome sequence of S. erythranum. A. Scatterplots of skew values calculated for the whole majority strand for 360 arthropods. The value for S. erythranum (-0.351, 0.350) is indicated by the triangle at left, with the other arthropods represented by diamonds. B. Nucleotide composition (center), AT-skew (below) and GC-skew (above) of all 13 PCGs and two ribosome RNA genes of the S. erythranum mitogenome. All values are calculated for the majority strand.

