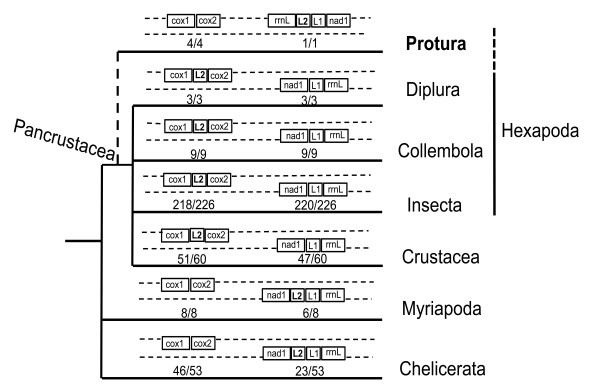
Figure 6.
Statistics and comparison of mitochondrial trnL2 patterns in all published mitochondrial genomes of arthropod lineages (until January 16, 2011). The ratios above the branches indicate the number of taxa with gene regions consistent with the pattern to the whole number of taxa whose mitogenomes are published.

