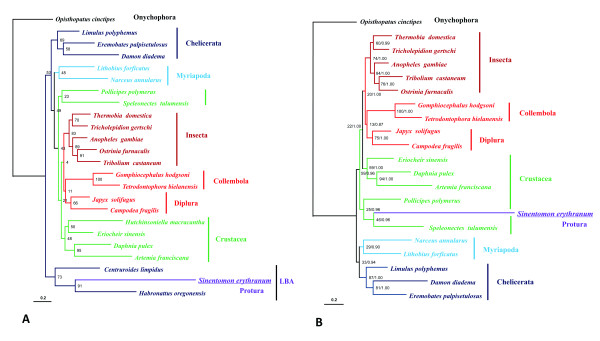
Figure 7.
Maximum likelihood trees of S. erythranum and other arthropod representatives based on the amino acid sequences of 13 mitochondrial PCGs. A. 24 taxa. Numbers at each node indicate bootstrap values of maximum likelihood analysis (100 replicates). B. 21 taxa. Numbers at each node indicate bootstrap values of maximum likelihood analysis (100 replicates, BS) and Bayesian posterior probabilities (PP) in format of "BS/PP".

