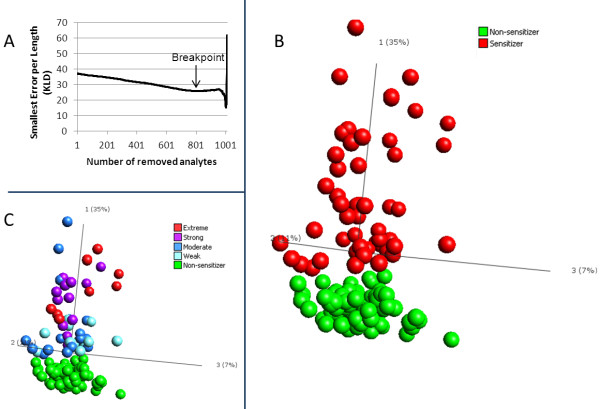
Figure 4.
Identification and PCA analysis of Prediction Signature. A) The number of differentially expressed significant genes in cells stimulated with sensitizing versus non-sensitizing chemicals (1010 genes) was reduced, using Backward Elimination. The lowest KLD is observed after elimination of 810 analytes, referred to as the Breakpoint. The remaining 200 genes are considered to be the top predictors in the data set, and are termed Prediction Signature. B) Complete separation between sensitizers (red) and non-sensitizers (green) is observed with PCA of the Prediction Signature. C) Same PCA as in B, now with samples colored according to their potency in LLNA.

