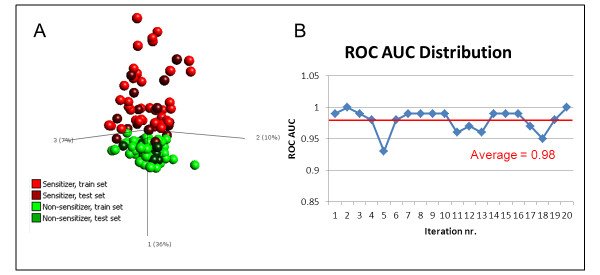
Figure 6.
Validation of selection procedure of Prediction Signature. The method by which the Prediction Signature was constructed was validated by repeating the process on 70% randomly selected data (training set). The remaining 30% of data was used as a test set for signature validation. The process was repeated for 20 iterations. A) A representative PCA of one of the 20 iterations, which demonstrates that the Test Gene Signature can separate skin sensitizers from non-sensitizers. Only the samples of the 70% training set, displayed in bright colors, were used to build the space of the first three principal components. The test set samples, displayed in dark colors, were plotted into this space based on expression levels of the analytes in the Test Gene Signature. B) An SVM was trained on the 70% training set, and validated with the 30% test set. The areas under the ROC curve from 20 such randomizations are plotted, yielding an average AUC value of 0.98. This indicated that the classification of samples in the test set was correct.

