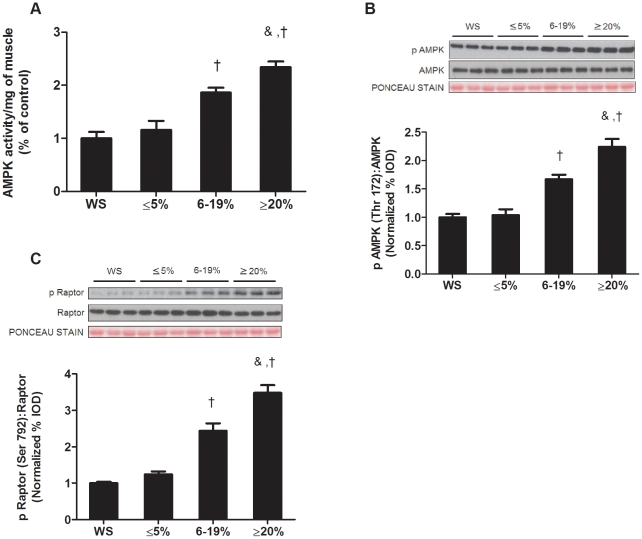
Figure 2. AMPK activation increases during late stage cachexia.
AMPK activation was measured in ApcMin/+ mice during the progression of cachexia. A) AMPK activity in the gastrocnemius muscle normalized to the WS mice. B) Upper: representative western blot of phosphorylated AMPK (Thr172) and total AMPK in the gastrocnemius. Lower: The ratio of phosphorylated to total forms of AMPK in the gastrocnemius muscle. C) Upper: representative western blot of phosphorylated raptor (Ser792) and total raptor in the gastrocnemius. Lower: The ratio of phosphorylated to total forms of raptor in the gastrocnemius muscle. Values are means ± SE. Significance was set at p<0.05. † Signifies different from WS mice. & Signifies difference from mice with ≤5% body weight loss. $ Signifies difference from mice with 6–19% body weight loss. WS, weight stable.

