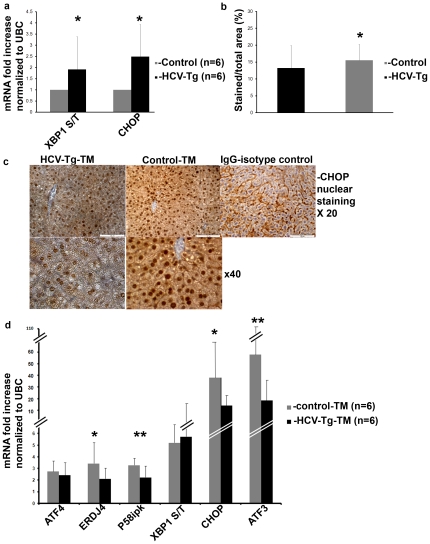
Figure 5. HCV-Tg mice display chronic ER stress and activate UPR genes less efficiently than controls following ER stress induction.
Untreated HCV-Tg and control mice were sacrificed, liver excised and RNA was extracted. (a) Expression of the ratio of XBP-1s to XBP-1u (S/T) and CHOP were assessed by real-time PCR. (Panels b, c and d) Mice were treated i.p. with tunicamycin injection of 1 mg/kg every other day (total of 2–3 injections), and were sacrificed 3 days following the last injection. (c) Immunostaining of formalin-fixed livers for CHOP (b) Quantification of stained nuclei was done automatically by visualizing the slides on an Olympus BX61 microscope, photography was performed on Photometric CoolSnap ES and analysis was done using Ariol SL-50 Applied Imaging 3.1.270 software. Untreated mice received 5% dextrose injection.(d) gene expression levels were determined by real-time PCR relative to UBC expression. Results are means±S.D. of 3 independent experiments. *p<0.05, **p<0.01 (ANOVA, one way) for (a) untreated control versus HCV-Tg mice and for (b, d) HCV-Tg control versus HCV-Tg tunicamycin treated mice.

