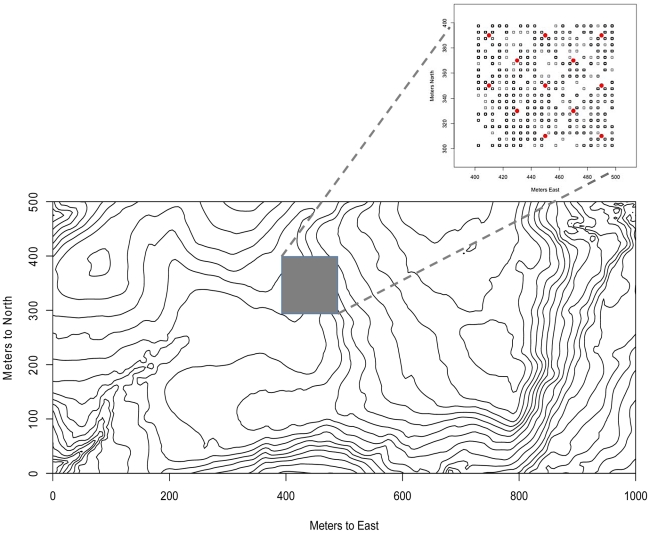
Figure 1. Map of sampled locations.
Overview map of the forest dynamics plot on Barro Colorado Island and the focal hectare (inset) sampled in this study showing the locations of the soil cores (red circles) and 1 m2 seedling quadrats (open squares) where the quadrat had at least one seedling during the sampling period of 2006.

