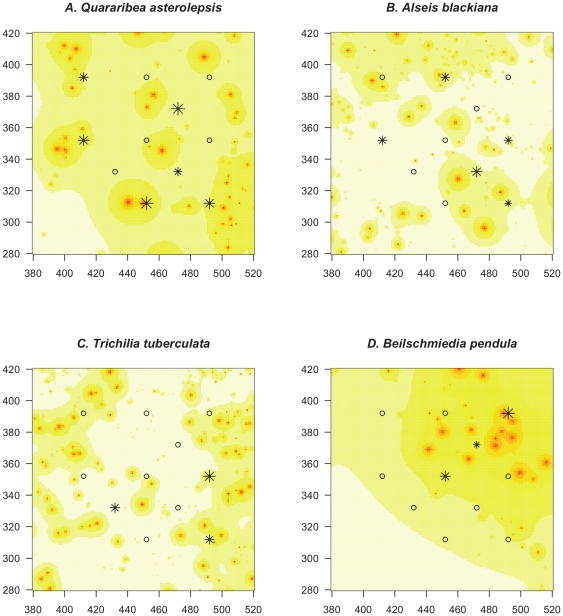
Figure 4. Maps of projected root distribution fits for four species.
Map of the projected distribution of roots of four species in the top 20 cm of soil based on the rooting distribution parameter values that were fitted for all species combined. The root sampling points at which roots of the focal species were found are indicated with stars, with size scaling to the frequency of the species in proportion mass of samples genotyped. The root sampling points at which no roots of the focal species were found are indicated by open diamonds. The color shows the expected root density of the focal species under the best-fit model, with red indicating the highest value, yellow intermediate, and white lowest.

