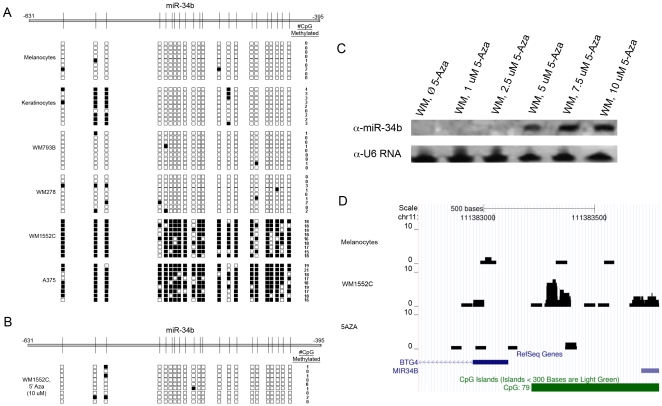
Figure 2. mir-34b 5′-UPS CpG island methylation in melanocytes, keratinocytes, and melanoma cells, and the effect of 5-Aza-dC demethylation on its expression in melanoma cells.
A) Frequency of CpG island methylation in the mir-34b 5′-UPS measured by bisulfite genomic sequencing (horizontal line at top; numbers represent nucleotides relative to the transcription start site, and vertical lines represent the positions of CpG islands). Nine clones from each cell line were tested. Black boxes represent methylated sites, white boxes represent no methylation. WM793B = Stage 1, WM278 = Stage 2, WM1552C = Stage 3, A375 = Stage 4. B) WM1552C cells were treated with 5-Aza-dC and the putative mir-34b promoter in nine clones was then examined for CpG island methylation (conventions as described in A). C) Northern blot analysis of miR-34b expression in WM1552C cells after treatment with various concentrations of 5-Aza-dC. U6 RNA was used as a loading control. D) Methyl-DIP deep sequencing of the upstream CpG island sequences of mir-34b in melanocytes, WM1552C, and 5-Aza-dC treated WM1552C cells. Y-axes depict RPKM values and the horizontal green bar indicates the CpG island. The histograms represent the extent of CpG methylation.

