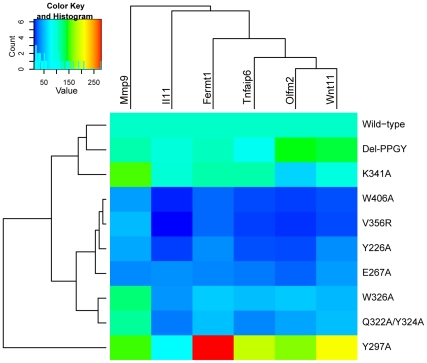
Figure 6. Heat map of gene activation in wild-type and mutant Smad3-expressing C2C12 cells.
Expression levels are shown as a percentage of wild-type expression after averaging duplicates. Genes and cells are ordered according to average-linkage hierarchical clustering, as implemented in the heatmap.2 function in the gplots R package [98].

