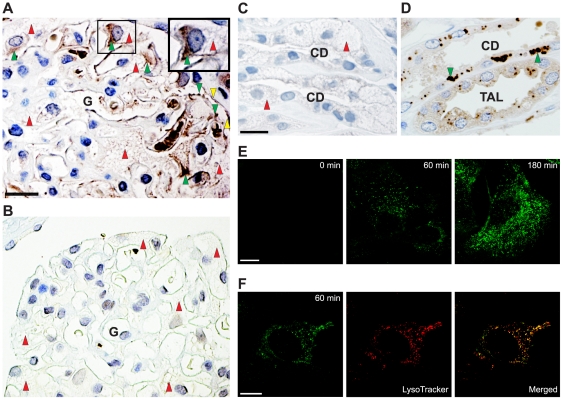
Figure 1. Uptake of recombinant α-Gal A by human podocytes.
(A) Peroxidase immunohistochemistry for α-Gal A in a biopsy from a male Fabry patient using anti-human α-Gal A antibody. The patient was intravenously infused with α-Gal A 2 h before the biopsy was taken. Labeling of a human glomerulus (G) showing α-Gal A localization in the podocytes (indicated with green arrowheads) and GL-3 inclusions seen as vacuoles (indicated with red arrowheads). Staining is also seen in parietal epithelial cells (indicated with yellow arrows). Scale bar, 25 µm. A high-power view of a portion of the glomerulus (top-right) demonstrates the localization of infused recombinant α-Gal in the podocyte. (B) For comparison, no α-Gal A labeling is seen in the podocytes in a biopsy from an untreated male Fabry patient. (C) The treated male Fabry patient shows no detectable labeling of endogenous α-Gal A in the collecting ducts (CD). Red arrowheads indicate heavy GL-3 inclusions. Scale bar, 25 µm. (D) A normal individual shows labeling of endogenous α-Gal A (green arrowheads) in both thick ascending limbs of Henle (TAL) and in CD. Scale bar, 25 µm. (E) Immunofluorescent demonstration of Alexa-Fluor 488-labeled α-Gal A uptake in human podocytes as a function of time at 37°C. At the indicated times, the cells were fixed and analyzed by confocal microscopy. Scale bar, 10 µm. (F) For colocalization of α-Gal A (green) and lysosomes (red) a merged image is shown. The yellow color illustrates colocalization. Scale bar, 5 µm.

