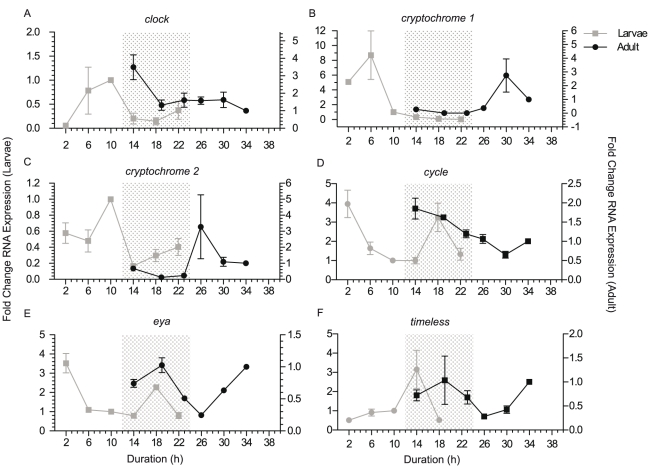
Figure 3. Comparison of larvae and adult diurnal gene expression. QPCR analysis of candidate circadian gene expression in larvae.
Larvae and adult tissues were compared using QPCR, to determine similar patterns of gene expression over a 12∶12 LD treatment (a. clock, b. cryptochrome 1, c. cryptochrome 2, d. cycle, e. eyes absent, f. timeless). Relative fold changes in RNA expression levels (mean ± SEM of triplicate QPCR reactions) are presented for both 2009 larvae (primary y-axis) and adult tissue (secondary y-axis). Shaded areas represent the 12 hours of darkness for larvae (12∶12 LD) and 11 hours of darkness for adult tissue (13∶11 LD).

