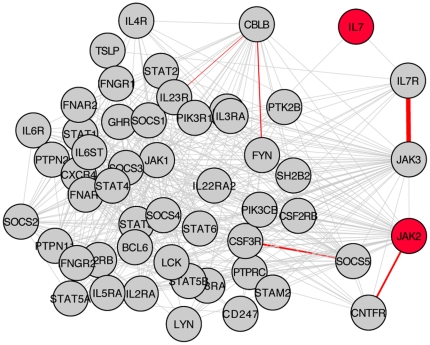
Figure 5. Sub-network of first neighbours of IL7R – JAK3 interaction.
A sub-network of the full immune network, containing all nodes separated by one edge from the IL7R – JAK3 interaction (52), and all their interactions (425). Nodes in red indicate genes with p<10−2. Edges in red indicate interactions with p<10−3, with thicker lines corresponding to lower p-values. The IL7 module is shown on the right part of the plot.

