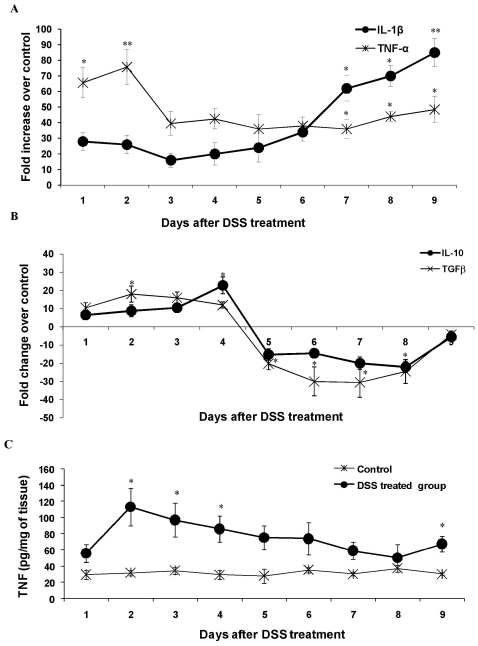
Figure 5. The effect of DSS treatment on pro-inflammatory and regulatory cytokine gene expression.
The relative gene expression levels were determined by real time PCR for (A) TNF-α (circle) and IL-1β (asterisks) and (B) TGFβ (circle) and IL-10 (asterisks) genes using mRNA extracted from control and DSS treated rats during 9 days of DSS treatment. Expression levels of all genes were normalized using GAPDH as housekeeping gene. The mRNA levels are plotted as fold change over control. Data shown are the means ± SEM of 6 animals/day. *P<0.05 and **P<0.001 compared to control colon. C: The effect of DSS treatment on the TNF-α protein secretion as measured by ELISA. TNF-α protein in DSS treated rats (circle) and controls (asterisks) are plotted as pg/mg of tissue. Data shown are the means ± SEM of 6 animals/day. *P<0.05 and **P<0.001 compared to control colon.

