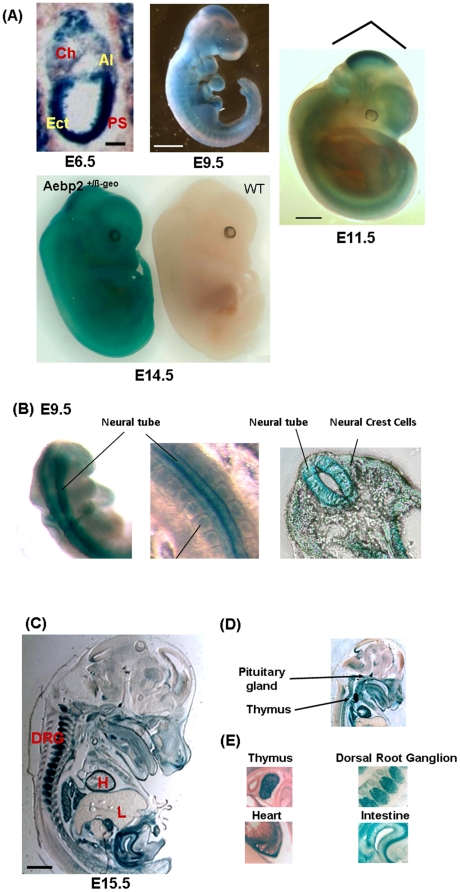
Figure 2. Spatial and temporal expression patterns of Aebp2.
(A) β-Gal staining of whole-mount embryos with different developmental stages. In 6.5-dpc embryos, high levels of Aebp2 is detected in ectoderm (Ect) and primitive streak (PS), modest levels in chorion (Ch) and allantois (Al). In 9.5-, 11.5-, 14.5-dpc embryos, Aebp2 expression is consistently detected in the midbrain section and also along the somites. Bars, 100 µm (E6.5) and 1 mm (E9.5, 11.5, 15.5). (B) β-Gal staining of E 9 embryos: dorsal view showing high expression of Aebp2 in neural tubes (left) and a zoomed view (center). A transverse section shows Aebp2 expression in neural tubes and also neural crest cells (right). (C) β-Gal staining of a sagittal-sectioned slide from a 15.5-dpc embryo. DRG (Dorsal Root Ganglion), H (Heart), and L (Liver). (D) A different sagittal section of a 15.5-dpc embryo showing the expression of Aebp2 in thymus and pituitary gland. (E) Zoom-in views of the Aebp2 expression in the thymus, DRG, intestine, and heart of a 15.5-dpc embryo.

