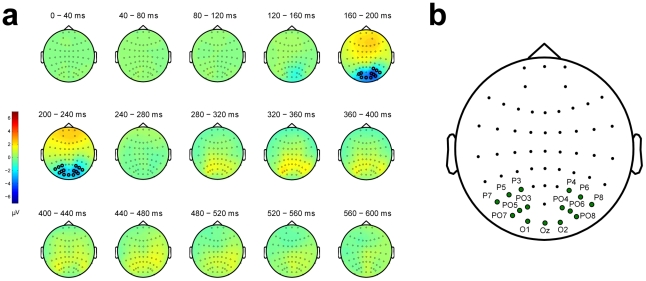
Figure 2. Electrodes of interest.
(a) Topographic maps representing the temporal evolution of the difference between the contour and the no-contour conditions (aggregated over iso-oriented and randomly-oriented displays). The electrodes in the significant cluster are highlighted. (b) Spatial layout of the 15 electrodes of interest, with their corresponding labels.

