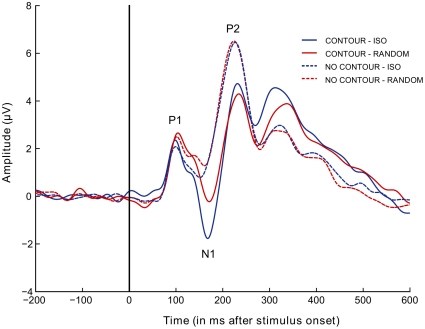
Figure 3. Condition-specific grand average ERPs.
Grand mean ERPs (n = 12), averaged over the 15 electrodes of interest (Figure 2b). Full lines represent conditions with an embedded contour; dotted lines represent conditions without an embedded contour. Blue: Iso-oriented conditions. Red: Randomly-oriented conditions.

