
Figure 1.
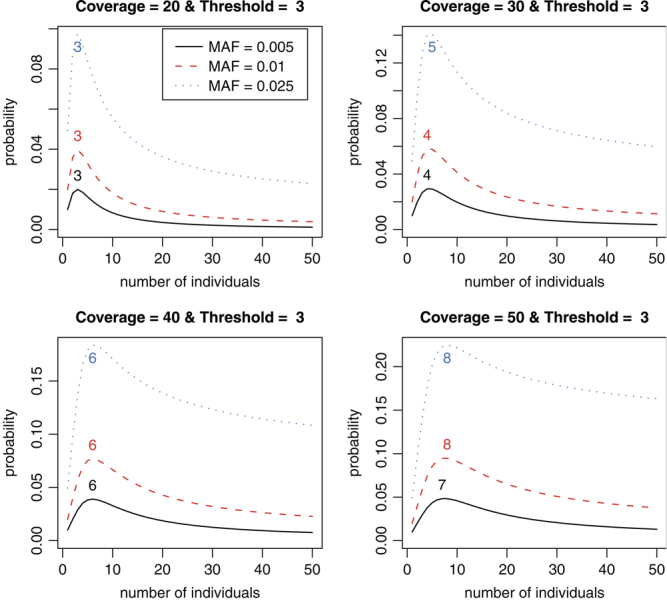
The optimal numbers of individuals on detection probabilities of the variants of P = 0.005, 0.01, and 0.025 with C = 20, 30, 40, and 50, threshold T = 3, and equal contributions. The number on each curve is the optimal number of individuals.