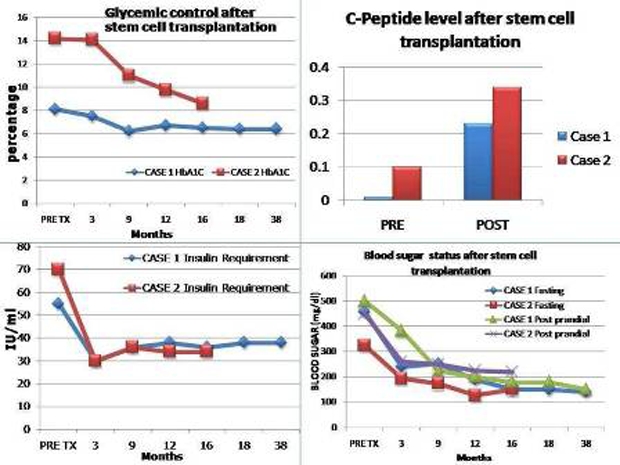
Figure 2.

Left upper corner-glycemic control after SCT denoted by glycosylated haemoglobin (Hb1Ac in percentage) in both patients. Left lower corner-insulin requirement after SCT in both patients (in IU/ml). Right upper corner-C-peptide level after SCT in both patients (in ng/ml). Right lower corner-Blood sugar (fasting and post prandial) status (in mg/dl) in both patients.
