
Fig. 5.
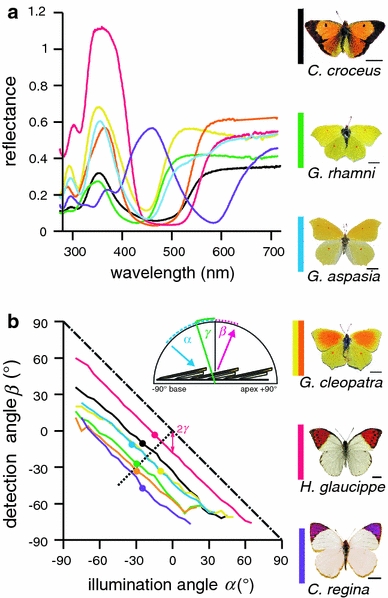
Reflectance spectra and angular dependence of the optimal iridescence path of the investigated pierid butterflies. a Reflectance spectra with the maximal short-wavelength reflectance measured with the ARM setup (at α ≈ β; for exact illumination and detection angles, see points in b). The line colours of the spectra are the same as those at the left of the photographs of the butterflies (right column, bars 1 cm). b Angular position of the detector (β) where the structural colouration is maximal as a function of the angular position of the illumination (α). The tilt angle γ can be read from the graph as half of the vertical (or horizontal) distance between the graph origin (α = β = 0°) and the optimal iridescence line, as is indicated with the arrowed line for H. glaucippe. The line of an ideal mirror is shown as a dash-dotted line. The experimentally measured positions of maximal iridescence are shown with thick dots and the expected positions for a tilted multilayer with a dotted line. The inset shows the arrangement of the scales on the wing, indicating the angles α, β and the multilayer tilt angle γ