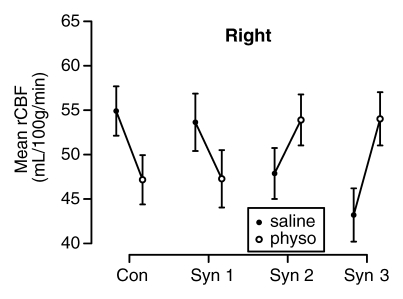
Figure 3b:
(a–d) Graphs show results of the cholinergic challenge experiment in Gulf War veterans with syndromes 1–3 (Syn 1, Syn2, and Syn 3, respectively) compared with those in a control group of well veterans (Con). (a, b) Graphs show group mean ASL-measured rCBF in the (a) left and (b) right hippocampus in session 1 (saline infusion) and session 2 (physostigmine [physo] infusion). (c, d) Graphs show group mean changes in ASL-measured rCBF in the (c) left and (d) right hippocampus with P values from contrasts in the mixed-effects linear model testing differences between syndrome groups and the control group. Error bars = standard errors of the mean.

