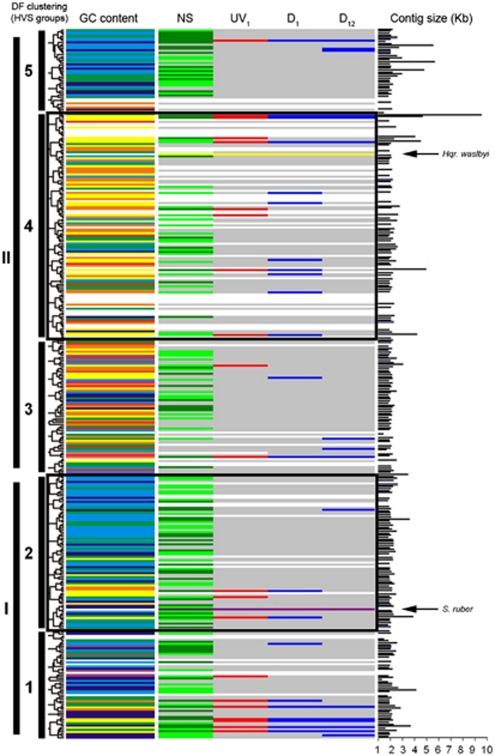
Figure 1.
Schematic representation showing the expression and overexpression of viral contigs. Clustering of HVSs is based on dinucleotide frequency analysis (DF). The GC content of each viral contig is also shown in colours (according to the rainbow spectrum, from low to high GC; for example, yellow is 45–50% GC and dark blue is 60–65%, as in Santos et al., 2010). The column labelled as NS shows the expression of viral contigs in the sample taken in May 2007, where contigs highly expressed are coloured in light green and contigs very highly expressed are indicated in dark green. Contigs marked in red in column UV1 are the contigs overexpressed 1 h after the UV-radiation treatment. Contigs marked in blue in columns D1 and D12 are the contigs overexpressed 1 and 12 h after the application of the osmotic shock. Black bars indicate the size of each contig, in kb. Arrows in panels show the position of Hqr. walsbyi and S. ruber genomes, according to their dinucleotide frequency (their GC content is also indicated by yellow and purple lines, respectively).

