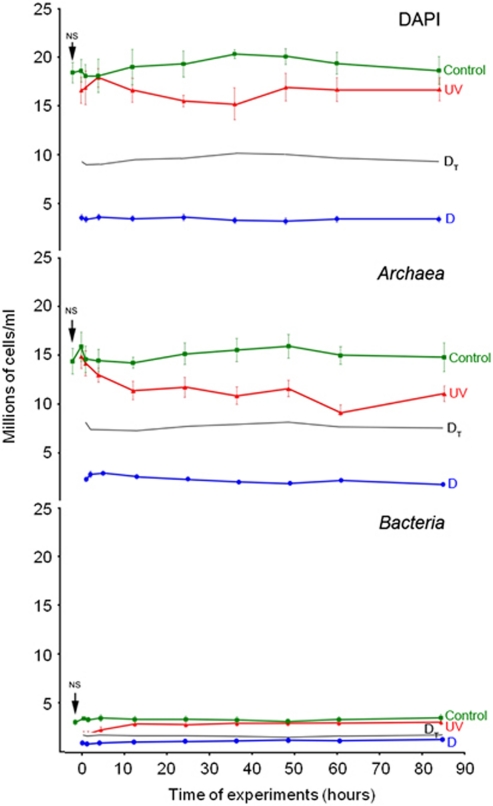
Figure 3.
Changes in the number of total cells (DAPI), Archaea and Bacteria with time after the application of the stress treatments, compared with values in the NS taken in May 2007. Green lines are the values of the control samples. In red (UV), the number of cells after the UV-radiation treatment. In blue (D), the number of cells under osmotic shock. Black lines (DT) represent the theoretical values after the dilution of the sample without considering lysis.

