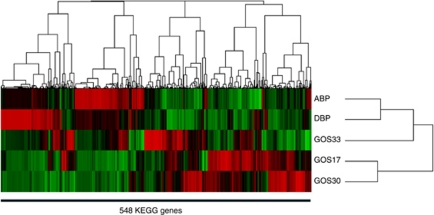
Figure 3.
Clustering of KEGG genes from the ABP and DBP in reference to three GOS data sets. Percentage of KEGG genes in the ABP and DBP metadata compared with those in the three reference GOS data sets. Only genes showing a >1% difference were used for the clustering. The color code indicates the relative abundance of the genes, ranging from green (low abundance) via black to red (high abundance).

