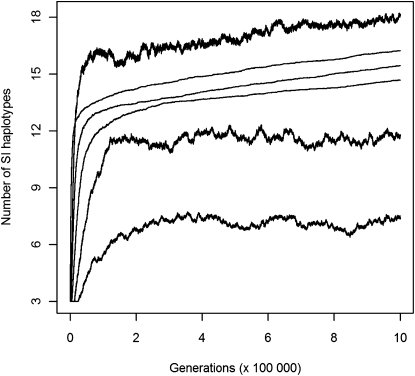
Figure 4.—
Diversification dynamics in finite populations across 106 generations. The number of SI haplotypes in the population was averaged over 100 replicates. Simulations were performed with N = 5000, μ = 5 × 10⁻⁵, δ = 0.9, the initial number of SI haplotypes n = 3, and for three different values of the maximum number of specificities (k) and two values of the proportion of self-pollen (α). Thick line, α = 0.2; thin line, α = 0.4. For a given α, curves correspond to k = 20, 100, and 200 from top to bottom.

