Figure 5.—
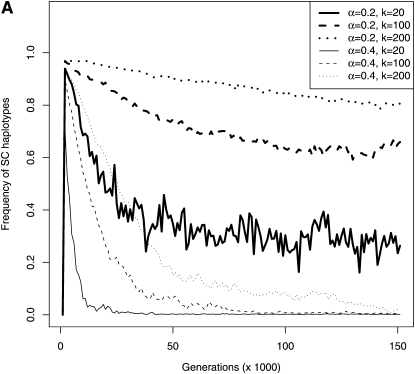
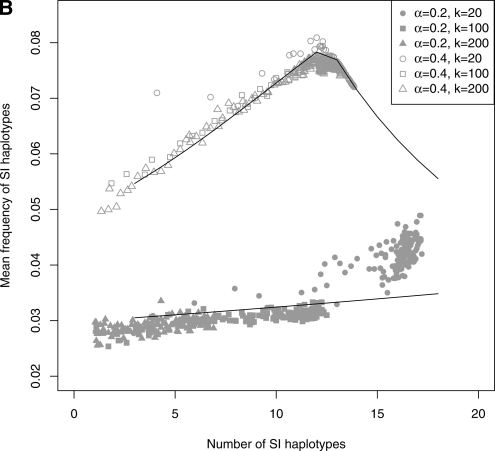
Genotypic composition of the population in the first 150,000 generations to investigate the dynamics of birth and death of SI haplotypes (genotypic frequencies sampled every 1000 generations in 20 replicates for N = 5000, μ = 5 × 10⁻⁵, and δ = 0.9). (A) Mean cumulated frequency of all SC haplotypes as a function of time. After an initial rapid increase in the total frequency of SC haplotypes, their frequency started to decrease as the number of SI haplotypes increased (see Figure 4). (B) Mean frequency of SI haplotypes as a function of their total number. Symbols are mean frequencies in simulations and lines are the expected frequencies at deterministic equilibrium in an infinite population (computed using equations in Appendix A1. Pollen-part mutation with a frequency of Sn, pn = 0 and setting n = x + 1 when x SI haplotypes were segregating within the population). For both values of α, the mean frequency of SI haplotypes increased with their total number. This is due to the fact that when the number of SI haplotypes increases, the total frequency of SC haplotypes decreases, thus leaving a larger range of frequency for SI haplotypes. When α = 0.4, the mean frequency of SI haplotypes decreased when their number was >12 because the frequency of SC haplotypes approached zero. There was no similar threshold value of the number of SI haplotypes in the case α = 0.2 because the frequency of SC haplotypes remained high.


