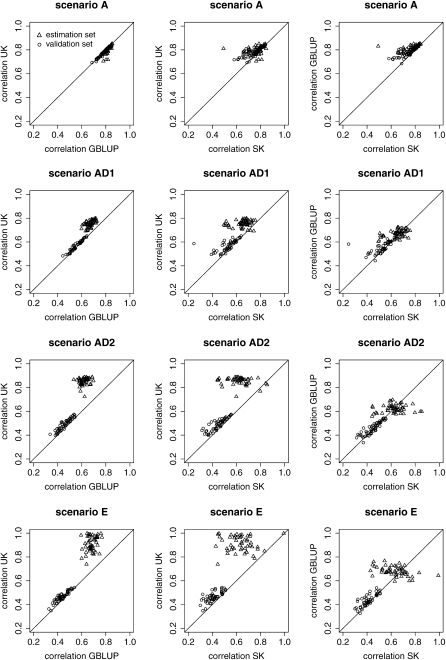
Figure 2.—
Scatterplot of the correlations between true and predicted GVs both for the estimation and the validation set and for the different scenarios [additive A, additive dominance with ratio of dominance to additive variance of 1 or 2 (AD1 and AD2), and epistasis E] to compare. Scatterplots are produced to compare universal kriging (UK) with genomic BLUP (GBLUP), UK with simple kriging (SK), and UK with GBLUP.

