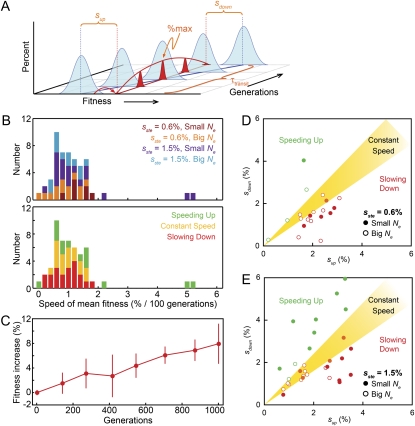
Figure 9.—
Rate of mean fitness increase. (A) A schematic of a clonal interference trajectory relating the parameters sup, sdown, and %max in terms of the fitness of the sterile subpopulation relative to the mean fitness of the population. The average speed of mean fitness increase is (sup + sdown)/τtransit, where τtransit = τdown – τup. If the speed of mean fitness increase is constant, the trajectory will be symmetrical with sup = sdown and %max occurring equidistant between τup and τdown. Asymmetry indicates either the slowing down (sdown < sup) or speeding up (sdown > sup) of the speed of mean fitness increase. (B) The average rate of mean fitness increase during the transit time of the sterile lineage, as inferred from the 51 high-quality clonal interference trajectories, color coded by propagation regime (top) and acceleration of mean fitness increase (bottom). (C) The rate of adaptation for 12 of the 51 populations for which standard (competitive fitness assay) measurements of mean fitness over time were available. This independent method of calculating the speed of mean fitness increase is consistent with the estimate of 1%/100 generations as estimated from the trajectories. (D) Relationship between sup and sdown in populations in which we observed 0.6%-effect sterile mutations; note the excess of trajectories in which the speed of mean fitness increase is slowing down. (E) Relationship between sup and sdown in populations in which we observe 1.5%-effect sterile mutations; these are not biased in terms of changes in mean fitness increase.

