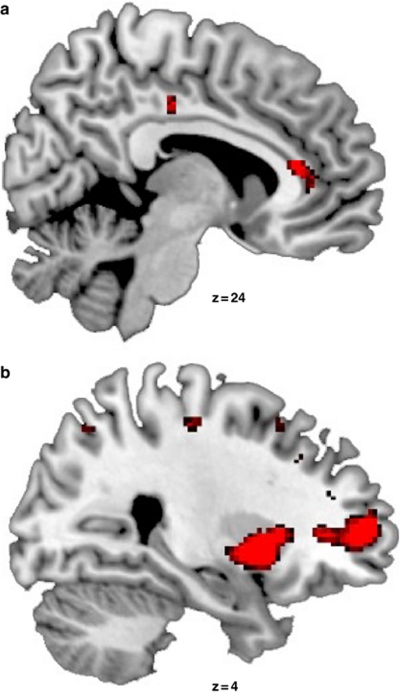
Figure 3.
Activation maps (threshold at p<0.001 uncorrected for displaying purposes) from the whole-brain analysis, superimposed on the sagittal slices of a standard T1 image provided with MRIcron, show the significant interaction between the factors drug and memory formation. As described under Results, this interaction is based on a larger subsequent memory effect in the placebo than in the duloxetine condition in (a) the right putamen and the middle frontal gyrus, as well as in (b) the right middle and the anterior cingulate cortex. The z-coordinates shown on the figure refer to the coordinates in MNI space for the local maxima found in the analyses, where MNI space is an approximation to Talairach space.

