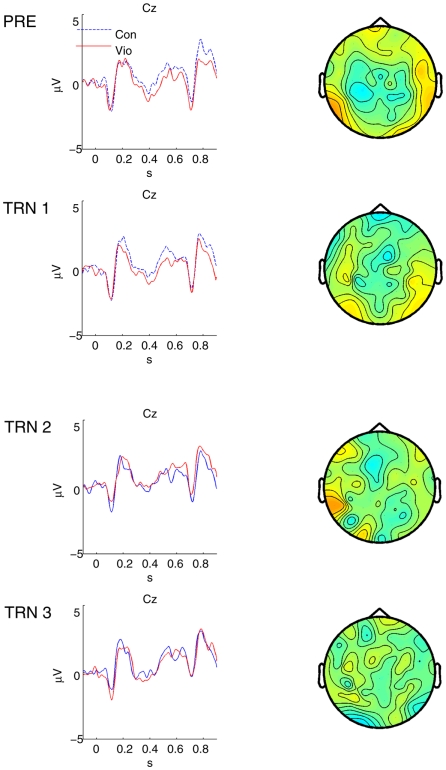
Figure 6.
Average event-related potentials for declension violation contrast (3 word). Trace plots indicate average voltage (in μV) as a function of time at Cz/1; control = Con, violation = Vio. There were no statistically significant clusters. Topographical plots are viewed from the top (left is on the left-hand side).

