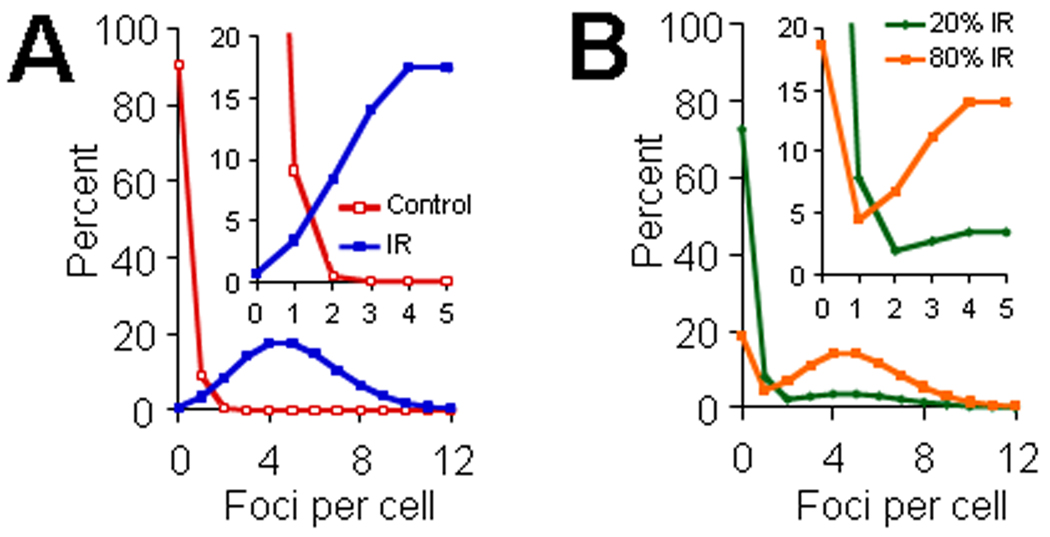
Fig.1. Scheme of γ-H2AX foci distributions for TBI and PBI.
(A) The left panel illustrates foci distributions for samples from TBI (blue color) and sham-treatment (red line). Poisson distributions with averages of 0.1 and 5 fpc were used to simulate control and TBI populations. The insert panel in Fig. 1A represents the same data shown in the left panel but magnified to illustrate the distribution pattern for foci numbers less than 6 foci per cell. (B) Right panel illustrates foci distributions in samples from PBI. Two PBI conditions are illustrated based on data shown in Fig. 1A; PBI involving 20% (B, green line) or 80% (B, orange line) of the lymphocyte population irradiated. See manuscript for additional details. The insert panel in Fig. 1B represents the same data shown in the right panel but magnified to illustrate the distribution pattern for foci numbers less than 6 foci per cell.

