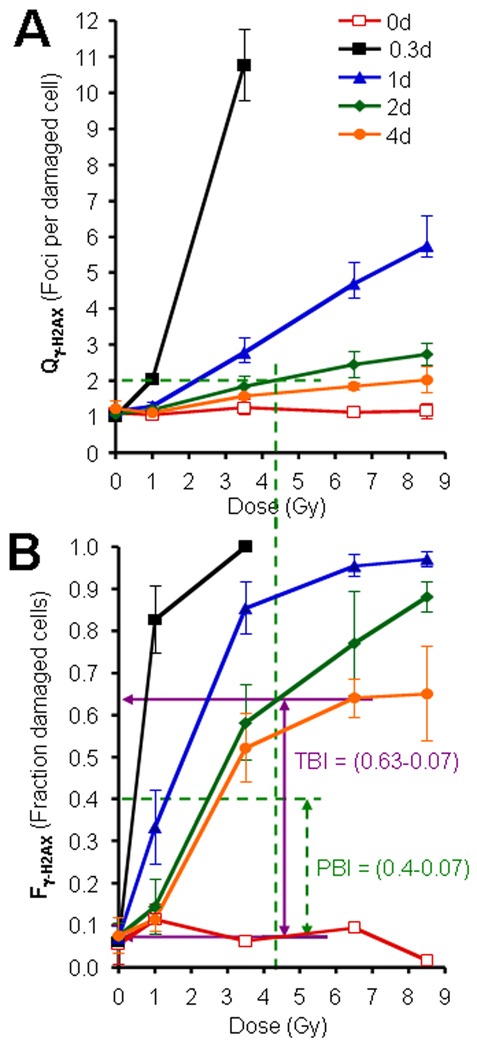
Fig.2. The use of Qγ-H2AX and Fγ-H2AX for partial-body irradiation (PBI).
(A) Graph of Qγ-H2AX (foci per damaged cell) vs TBI exposure. This value approximates the dose received by the lymphocytes in the fraction of the body subjected to irradiation, independent of the size of that fraction. (B) Graph of Fγ-H2AX (fraction of damaged cells) vs TBI exposure. This value is used to approximate the PBI fraction. For example, assume values of Qγ-H2AX = 2, and Fγ-H2AX = 0.4 were calculated from lymphocytes obtained from a subject 2 days after irradiation of unknown amount and bodily distribution. The Qγ-H2AX value indicates that the exposed portion of the subject received ~4.4 Gy (panel A, green dashed lines). If the subject had been exposed to TBI of 4.4 Gy, then an Fγ-H2AX of ~0.63 would be expected in lymphocytes taken 2 days after irradiation (Solid horizontal violet arrow in panel B). Thus, an Fγ-H2AX of ~0.4 (horizontal dashed green line) indicates that the subject received less than TBI. Taking into account the control values, the PBI fraction is estimated as (0.4–0.07)/(0.63–0.07) = ~59% of the body being irradiated. Graph in panel B uses the same legends as Graph in panel A. Errors bars represent standard deviations of the mean (n=6).

