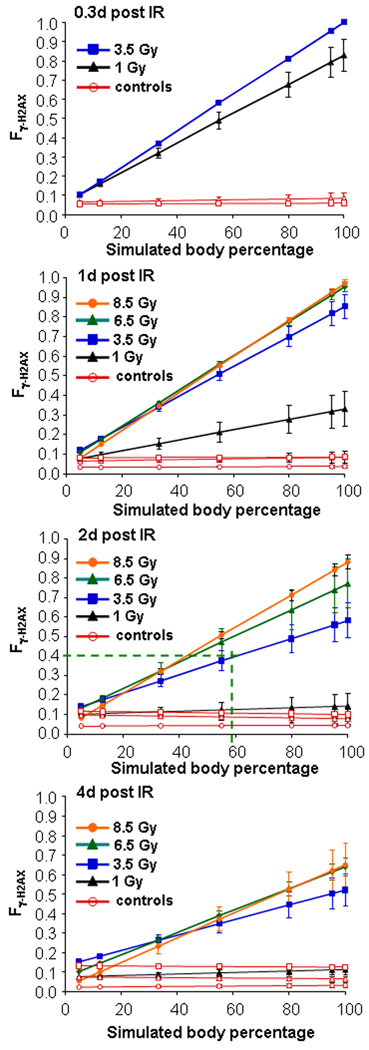
Fig.3. Graphs of Fγ-H2AX vs body percentage in a computer simulation of PBI.
To test the consistency of the PBI estimate, various mixtures of total body and sham exposed γ-H2AX foci distributions of lymphocytes were used to simulate situations in which 5, 12.5, 33, 55, 80, and 95% of the body was exposed to irradiation (as demonstrated for 20 and 80% in Fig 1B). Fγ-H2AX values were calculated for these mixtures for the different irradiation exposures and phlebotomy times. In the example given above, on the graph of 2 days post irradiation (third panel from top), the calculated PBI percentage of 59% and the Fγ-H2AX value of 0.4 intersect slightly above the line for 3.5 Gy and below the line for 6.5 Gy, consistent with the estimated value of 4.4 Gy (see text for further explanation). Closed symbols: irradiated macaques; open symbols: sham-irradiated controls. Errors bars represent standard deviations of the mean (n=6).

