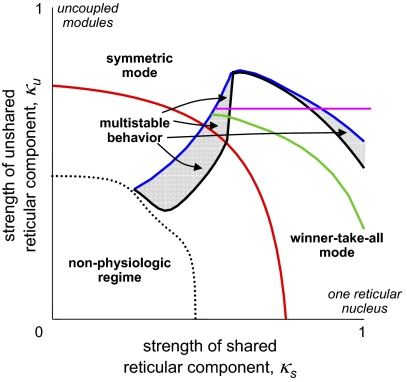
Fig. 2.
Bifurcation diagram for the pair of coupled thalamocortical modules illustrated in Fig. 1. Dotted black curve: boundary of the physiological regime. Blue curve: fold bifurcation, below which a winner-take-all (WTA) mode exists. Black curve: pitchfork bifurcation, below which the symmetric mode is unstable. Red curve, Hopf bifurcation, below which the symmetric mode is oscillatory. Green curve: Hopf bifurcation, below which the WTA solutions are oscillatory. Note that in all parts of the gray region, symmetric and WTA modes are both stable. The purple line segment serves as an anchor for the region explored in Fig. 4. This figure was redrawn, with permission, from Drover et al. (10), figure 6A.

